Failing to sustain a consolidation range, the SOL price reverses within the falling channel leading to a bearish range breakout. The breakdown rally retests and continues to crash below $25, increasing the retracement to 18% within the falling channel.
Currently, the SOL price action shows lower price rejection from the midline to rechallenge the overhead resistance trendline. Additionally, the reversal finds footing at the $23 support, presenting a double-bottom reversal.
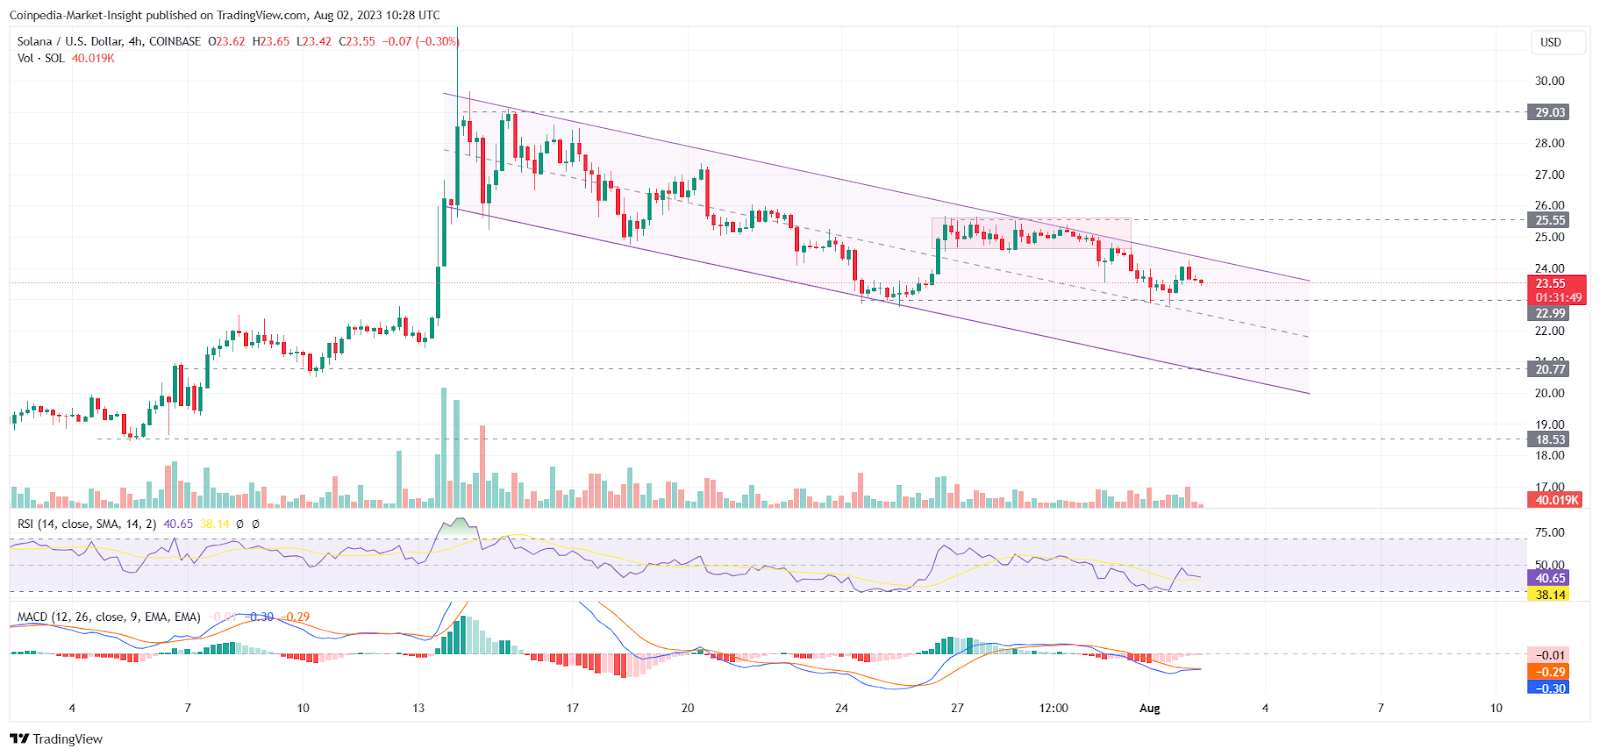
With multiple long-tail candles, SOL price action highlights buyers struggling to absorb the supply pressure. Moreover, the Solana coin price is down by 1.83% in the last 24 hours, representing a stronger bearish side.
The double bottom forming at the $23 support level finds no RSI bullish divergence. The RSI line reverses from the halfway line after the sudden spike, maintaining an overall downtrend. However, the MACD indicator shows a bullish crossover in action, supporting the resistance breakout theory.
Considering the downtrend continues, a breakdown below $23 will signal a selling opportunity for Solana traders. The breakdown rally can challenge the bullish dominance at $20, accounting for a 12% drop.
On the flip side, an upside breakout of the falling channel will unleash the trapped bullish momentum and challenge the supply pressure at $30. However, the rally might face some opposition at the $25 mark.
In times when the crypto market appears strong, despite resistance, some altcoins like Humanity Protocol…
Binance founder Changpeng Zhao (CZ)'s tweet is going viral, claiming that Satoshi Nakamoto, the mysterious…
Everyone has that one friend. The one who keeps reminding you how they bought Bitcoin…
This month alone, over 2.5 million new tokens have been created across major blockchains, including…
Charles Hoskinson says Bitcoin DeFi presents the biggest opportunity for Cardano right now. However, while…
The long-running legal fight between Ripple and the SEC is finally over. After the official…
