Pepecoin has been on the watchlist of many, if not all, meme coin holders and investors. The buzz has been driven by its stupendous growth on the price chart in the past, and its bullish social metrics. Talking about Pepe price, it is up a healthy 72.96% over the past month, and has broken out of patterns to defy odds. In this Pepecoin (PEPE) price analysis, we outline the possible short-term targets for you to mark your positions.
Pepecoin (PEPE) price has broken out of a rounded bottom formation on its 4-hour price chart, a key bullish pattern that suggests a further upside. After climbing 72.96% over the past month and 12.89% in the past day, PEPE is trading at $0.00001561, just below its local resistance at $0.0000160.
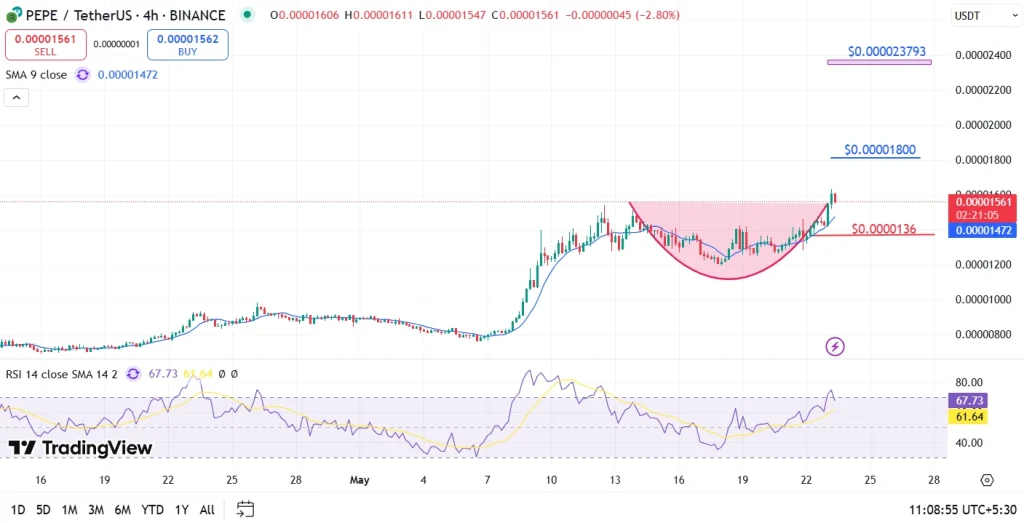
Successively, the neckline, which acted as resistance during the pattern’s formation, has now been breached, and PEPE is attempting to establish a higher support zone. The RSI is currently at 67.73, approaching the overbought territory, indicating strong momentum but also the potential for short-term consolidation at $0.0000165.
If the memecoin defies odds to chug up big, it could target its resistance at $0.00001800. Claiming that, the next big milestone is at $0.00002378. However, on the downside, profit taking could plummet the price to $0.0000136.
Also read our Pepecoin (PEPE) Price Prediction 2025, 2026-2030 for long-term price targets!
The Pepecoin price is currently at $0.00001577 with an intraday gain of 12.89%, which is assisted by its $2.42 billion worth of daily trading volume.
The rounded bottom breakout confirms a bullish reversal, suggesting strong upward continuation if volume supports the move.
A breakdown below $0.00001500 could lead to a retest of the key support zone at $0.00001360, potentially invalidating the breakout pattern in the short term.
Lightchain AI enters its Bonus Round with precision timing, capitalizing on a foundation built through…
Traders focused on Cardano are turning their attention to a new project set to launch…
The crypto market has been unusually quiet lately, but that calm might not last much…
XRP is currently stuck in a tricky situation as its price struggles to pick a…
Dogecoin price has remained quiet for many months, but the data highlights a storm building…
Bitcoin’s price has been moving sideways in recent sessions, but a big breakout could be…
