Today, April 9, 2025, following the opening bell of the US market, the overall cryptocurrency market jumped by 1.90%, indicating a potential upside rally. Amid this, Pepe (PEPE), the popular meme coin, has formed a bullish price action and is poised for a massive upside rally.
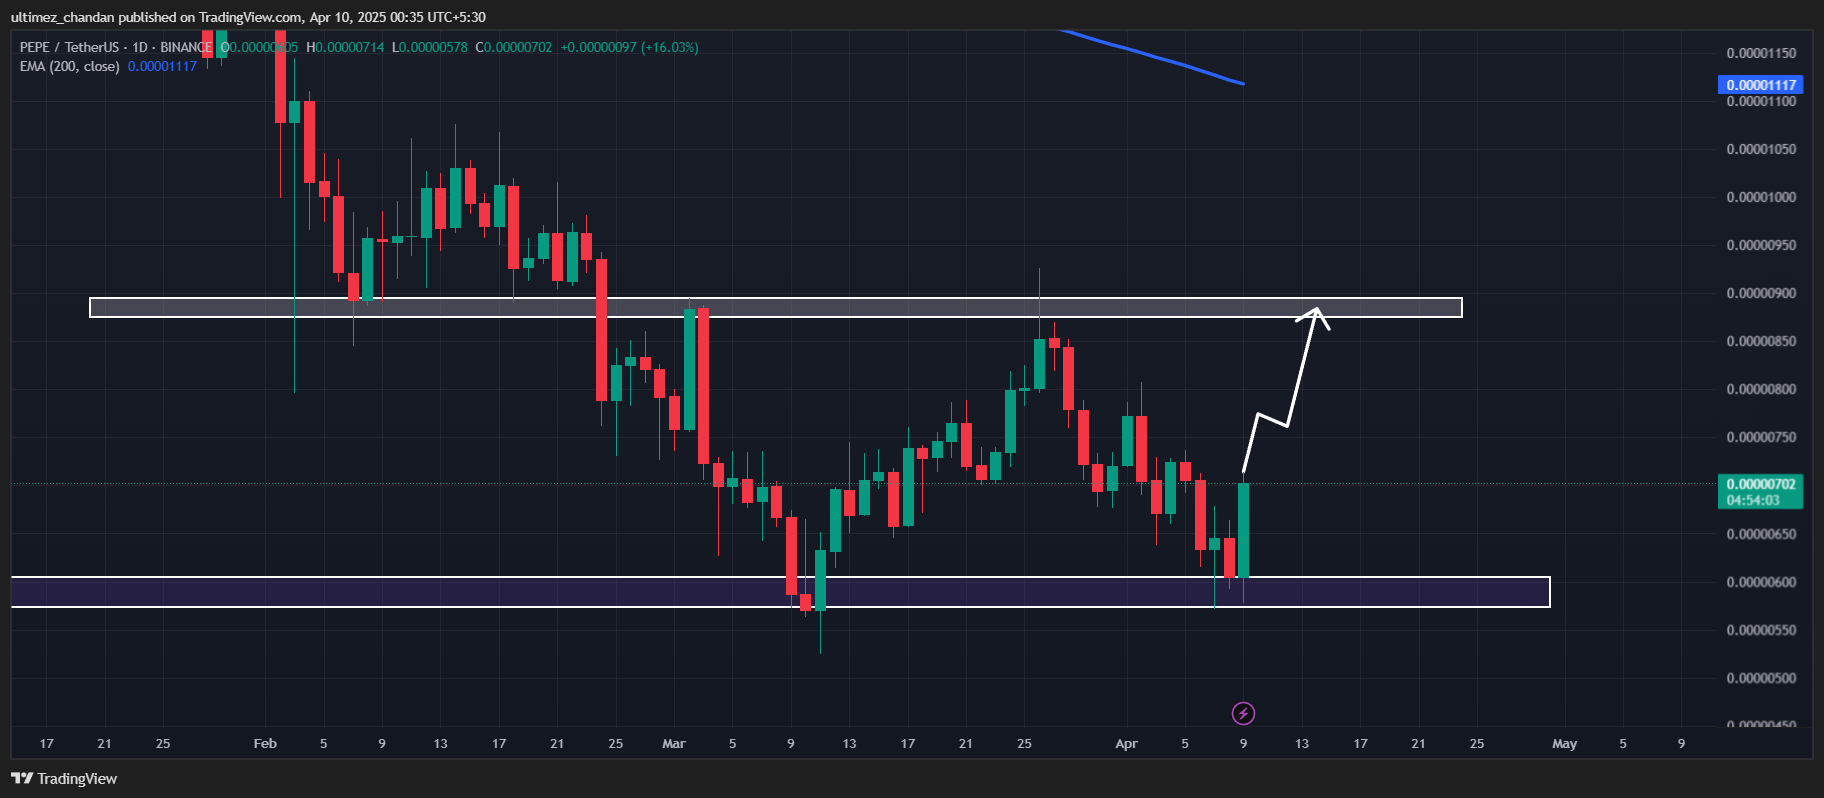
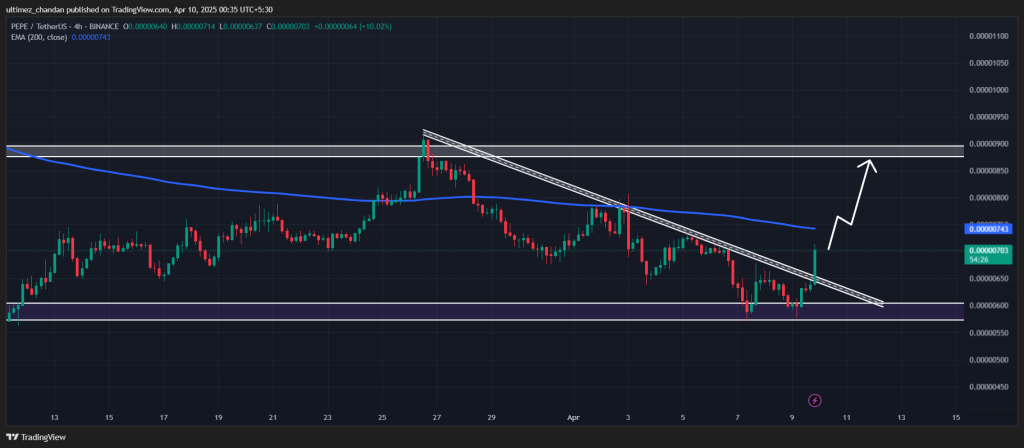
According to expert technical analysis, PEPE appears to be forming a bullish double-bottom price pattern on the daily time frame. In addition to this bullish pattern, the meme coin has also broken out of a descending trendline that it had been following since March 26, 2025.
Based on recent price momentum and historical patterns, if the PEPE price holds above the $0.00000678 level, there is a strong possibility it could soar by 30% to reach the $0.0000090 level in the future.
Despite this bullish price action, PEPE is currently trading below the 200-day Exponential Moving Average (EMA) on the daily time frame, indicating strong bearish sentiment for the asset.
At press time, PEPE is trading near $0.00000698 and has registered a price surge of over 15% in the past 24 hours. Meanwhile, during the same period, its trading volume jumped by 75%, indicating heightened participation from traders and investors compared to the previous day.
The potential reason behind this sudden price surge is President Donald Trump’s recent post on X (formerly Twitter). In the post, Trump stated, “I have authorized a 90-day PAUSE, and a substantially lowered Reciprocal Tariff during this period, of 10%, also effective immediately. Thank you for your attention to this matter!”
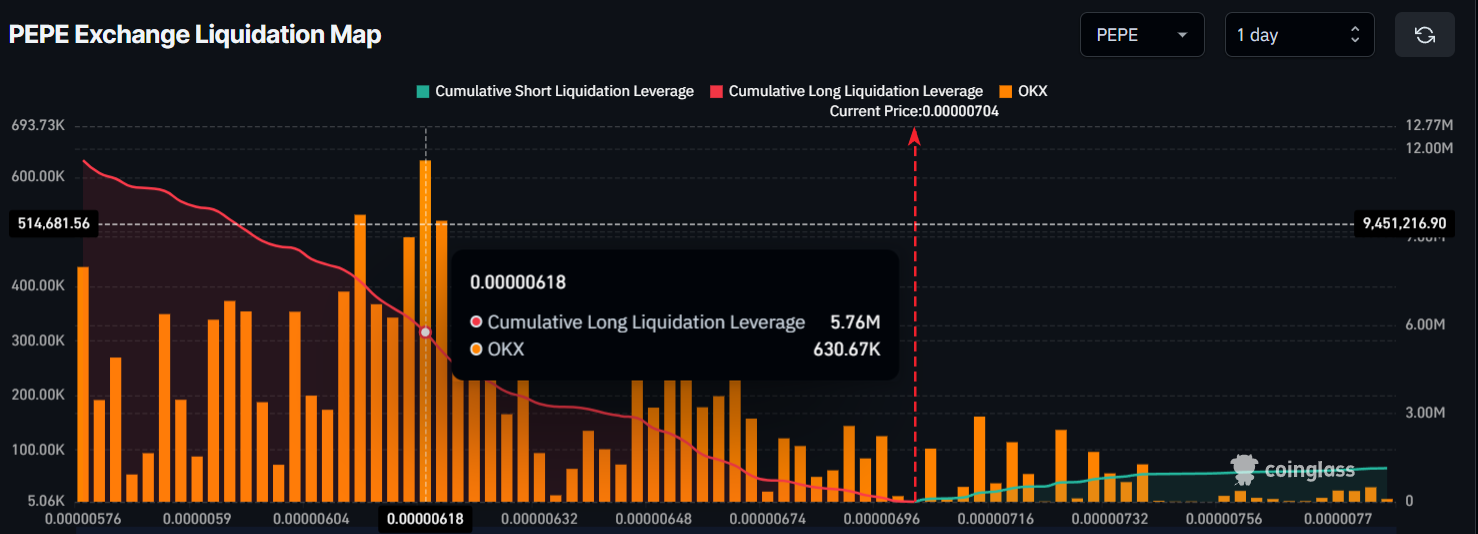
Following this announcement, the overall market—and PEPE in particular—turned bullish, with intraday traders also shifting their positions toward the bullish side, as reported by on-chain analytics firm Coinglass.
Data revealed that traders are currently over-leveraged at $0.00000618 on the lower side (support) and $0.00000714 on the upper side (resistance), having built $5.76 million and $305.60k worth of long and short positions, respectively, over the past 24 hours.
This metric suggests that the bulls are back and currently dominating the asset, potentially driving the meme coin’s upside momentum.
New U.S. stablecoin legislation is driving a significant increase in stablecoin issuance from banks, asset…
Robinhood has introduced staking for Ethereum (ETH) and Solana (SOL) to its U.S. customers, enabling…
The United States and European Union are reportedly close to finalizing a trade agreement to…
Last week, Ethereum (ETH) spot trading volume surged to $25.7 billion, surpassing Bitcoin’s (BTC) $24.4…
The Senate Agriculture Committee will release its draft bill on CFTC regulation of digital commodities…
XRP, Solana, BONK, Hyperliquid, TRX, and ENS are dominating trader focus today as on-chain momentum…