Every year, as May starts, a popular phrase begins to circulate in financial circles, “Sell in May and go away.” However, this may hold more weight during bear markets, as historical data shows that May has often marked the beginning of deeper corrections.
Crypto Trader believes Bitcoin could fall to $30,000 if fail to reclaim April’s high near $79,500 within the first five days of May.
So, will the famous “Sell in May and go away” pattern happen again, or will Bitcoin break the trend this year?
Many traders are watching May closely because Bitcoin has seen major drops during the past midterm years. For example, in 2014, Bitcoin fell by around 61%. In 2018, it dropped about 65%, and in 2022, it declined nearly 66%.
All three big downturns started around May, which is why many traders pay close attention to this period.
Well-known crypto analyst Crypto Rover said a similar setup may be forming again. He noted that in 2018, Bitcoin rose for five straight weeks before May, then fell sharply.
Now in 2026, Bitcoin has already recorded four green weeks in April, and a fifth is possible as Bitcoin is already up by 2% on 1 May.
Because of this pattern, Rover thinks May seasonality, combined with current technical weakness, creates a dangerous setup for investors rushing back into crypto too early.
Looking at Bitcoin’s monthly return history since 2013, May ranks as the 6th best month by average return and the 3rd best month by median return. That means May has often been a solid month for Bitcoin.
Some of the strong gains include 52% in May 2019, 52% in May 2017, and nearly 39.4% in May 2014. Meanwhile, last year in May, it saw a jump of 11%. However, these numbers show May is not always a bad month.
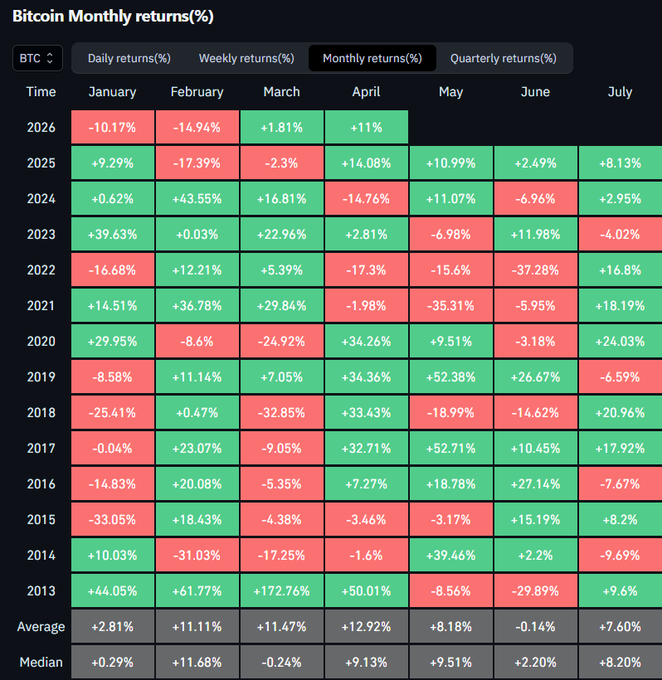
Yes, there were weak years too. But the traditional “Sell in May” theory does not always apply directly to Bitcoin.
Since 2018, Bitcoin closed May in the red only four times out of eight years. This shows the strategy is not fully reliable for Bitcoin. Usually, markets just become slower from May to June, with fewer big price moves.
However, one pattern stands out. Since 2020, when Bitcoin failed to break April’s high in the first five days of May, the rest of the month fell at least 5%. And the average drop was nearly 20%.
Last year in 2025, Bitcoin broke April’s high on May 1 and then rallied 16.9% to $112,000 by May 22.
This year, April’s high near $79,500 is the key level to watch.
Because of this, analyst DefiTracer says Bitcoin could drop toward $30,000 if the “Sell in May” pattern happens again.
As of now, Bitcoin is trading around $77,141, up 2% in the last 24 hours, with a market value of $1.54 trillion.
Spot Bitcoin ETFs have also been absorbing recent selling pressure, helping balance the market. They have been one of the main drivers behind Bitcoin’s move to new all-time highs.
For now, the smart move is not to panic sell in May, but also not to ignore market signals.
The WLD price is approaching a make-or-break zone. The weekly chart shows resistance between $0.56…
The NEAR price is pushing higher again after bouncing from $4.34 support, and bulls are…
NEAR Protocol (NEAR) & Worldcoin (WLD) prices have turned out to be among the top…
How can beginners participate in computing infrastructure and earn rewards without buying mining equipment or…
China could become a major driver of the next crypto market cycle if it finds…
Amazon (AMZN) stock climbed 3.29% on Friday, putting its next major resistance level at $280…

